Common input material
Growth ideaUser journeyHistorical dataChannel planExperiment constraints
A growth idea that stays a single sentence is hard to judge. NuromBoard breaks target users, trigger moments, experiment variables, metrics and risks into a whiteboard structure you can take straight into review.
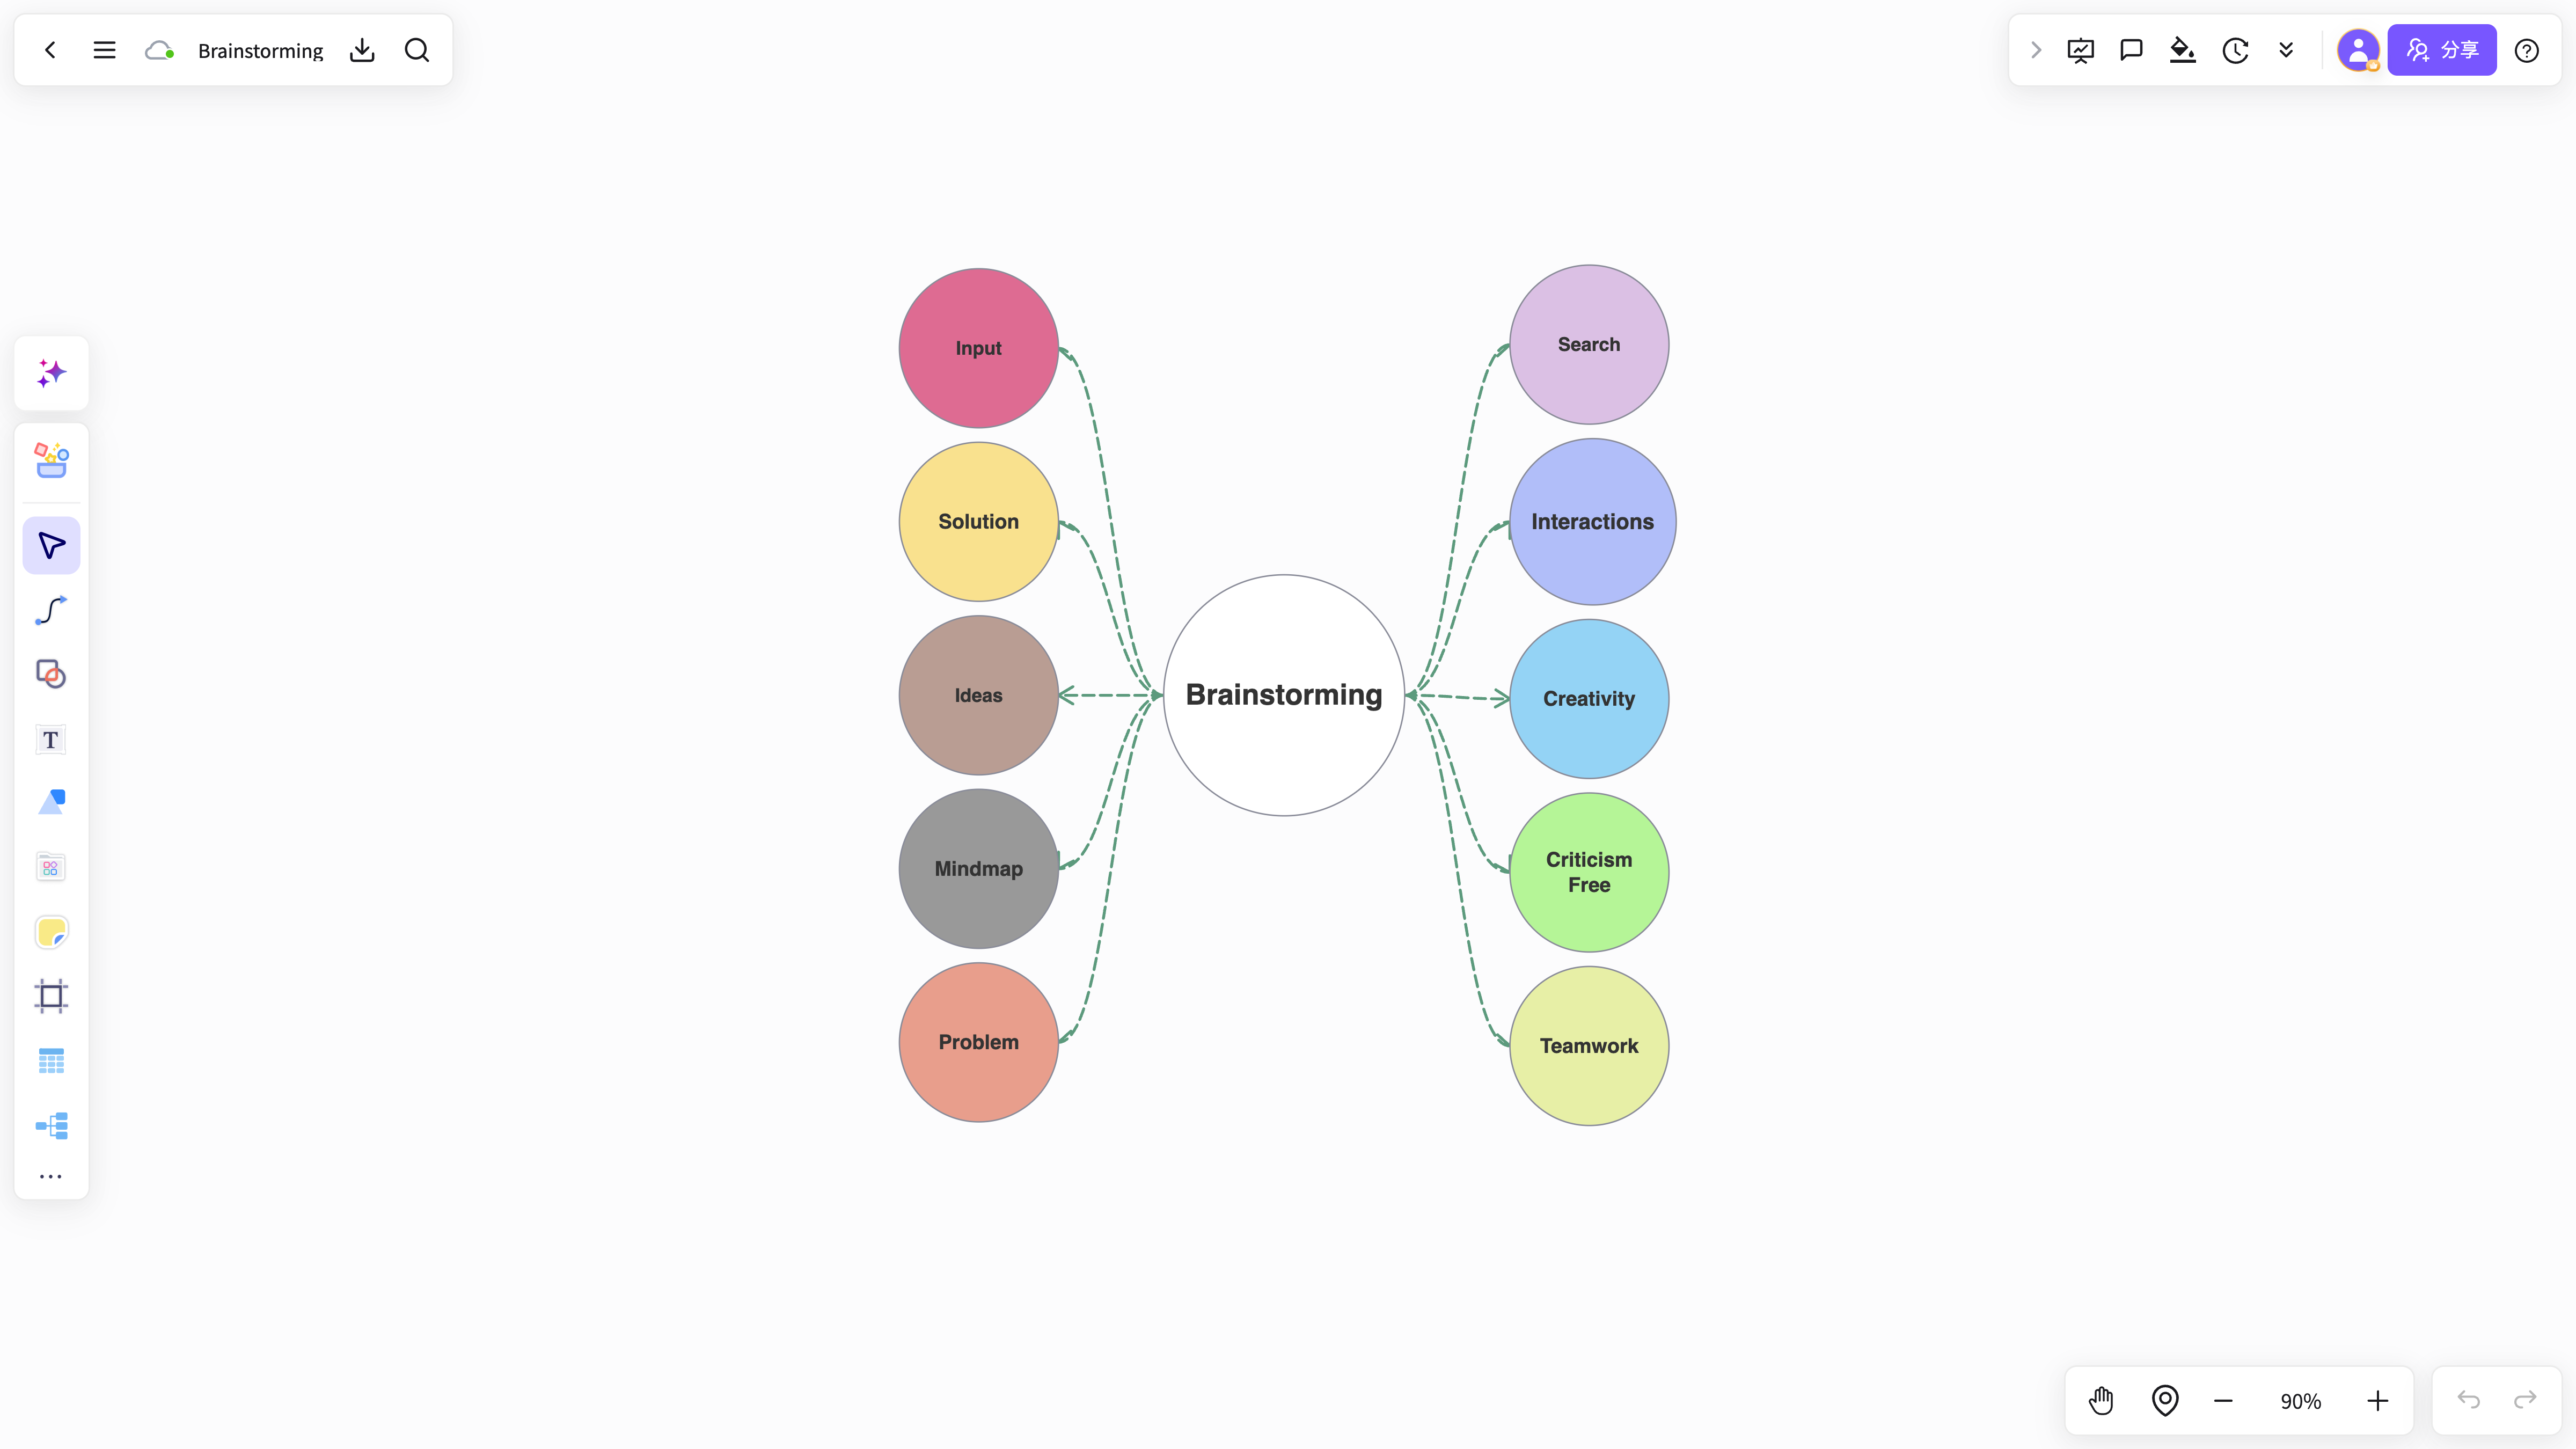
Growth discussions drift easily, so hypotheses, impact and cost need to be compared side by side.
Without a clear metric there is no way to tell whether an experiment actually worked.
Sample, duration, channels and risks stay undefined, so execution drifts once it starts.
State the target user, trigger moment, expected behaviour and core metric clearly.
Lay out channels, creative, journey, sample, duration and risk constraints.
Produce the experiment board, a priority call and the next-action list.
The board catches the ideas, while mind map and cards help the team converge on an experiment structure.
After the experiment, data and conclusions keep accumulating in the same project.
Breaks a growth idea down into an experiment structure.
View and use the template →Compares impact, cost and risk in one view.
View and use the template →Separates goal metrics from process metrics clearly.
View and use the template →The scenario page answers how the work starts; the method articles continue with the steps, the criteria, and where NuromBoard fits.
Yes. A whiteboard puts the hypothesis, user journey, experiment variables and metrics in one shared view for discussion.
A to-do list only records actions, while a growth whiteboard also captures the hypothesis, metrics and risks behind those actions.