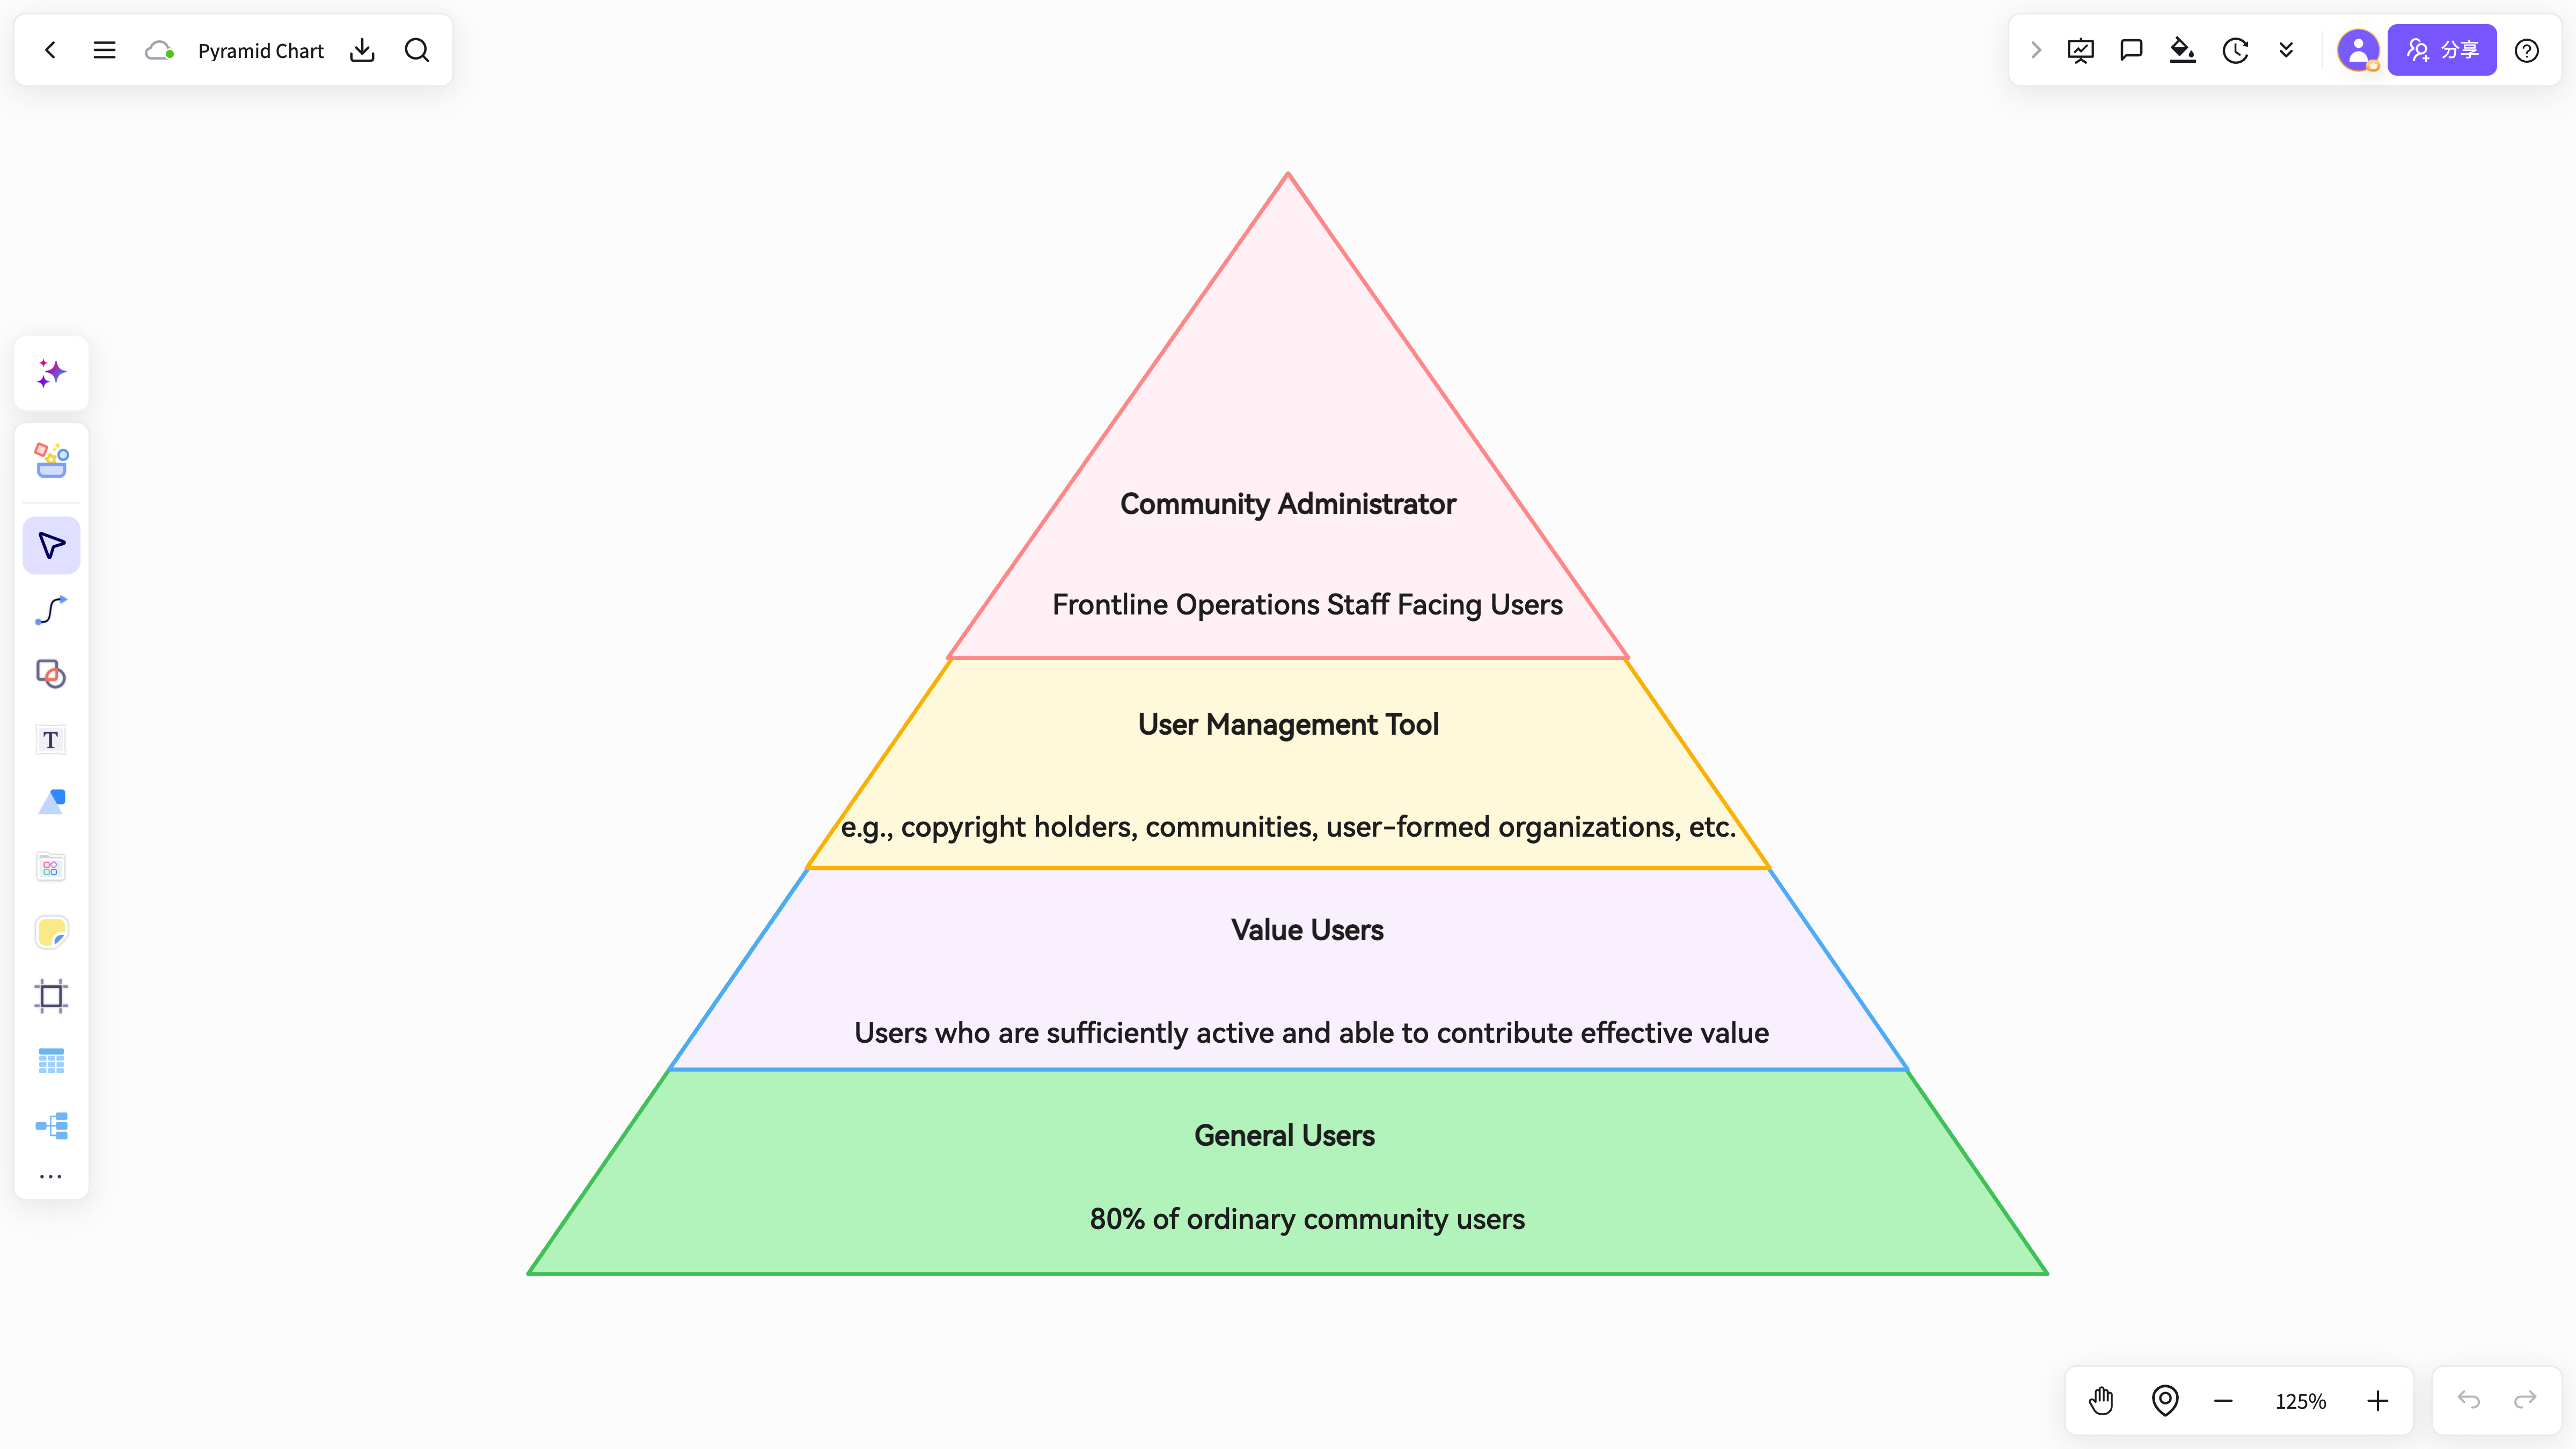
AI-generated pie charts
Ideal for share analysis, budget breakdowns, user sources, and distribution views.
Use NuromBoard to generate pie, bar, line, and other common charts with one prompt. Move from data context and business background to editable drafts, collaboration, and presentation output.
Choose the best chart for your data, then refine its style, structure, and supporting conclusions.
Ideal for share analysis, budget breakdowns, user sources, and distribution views.
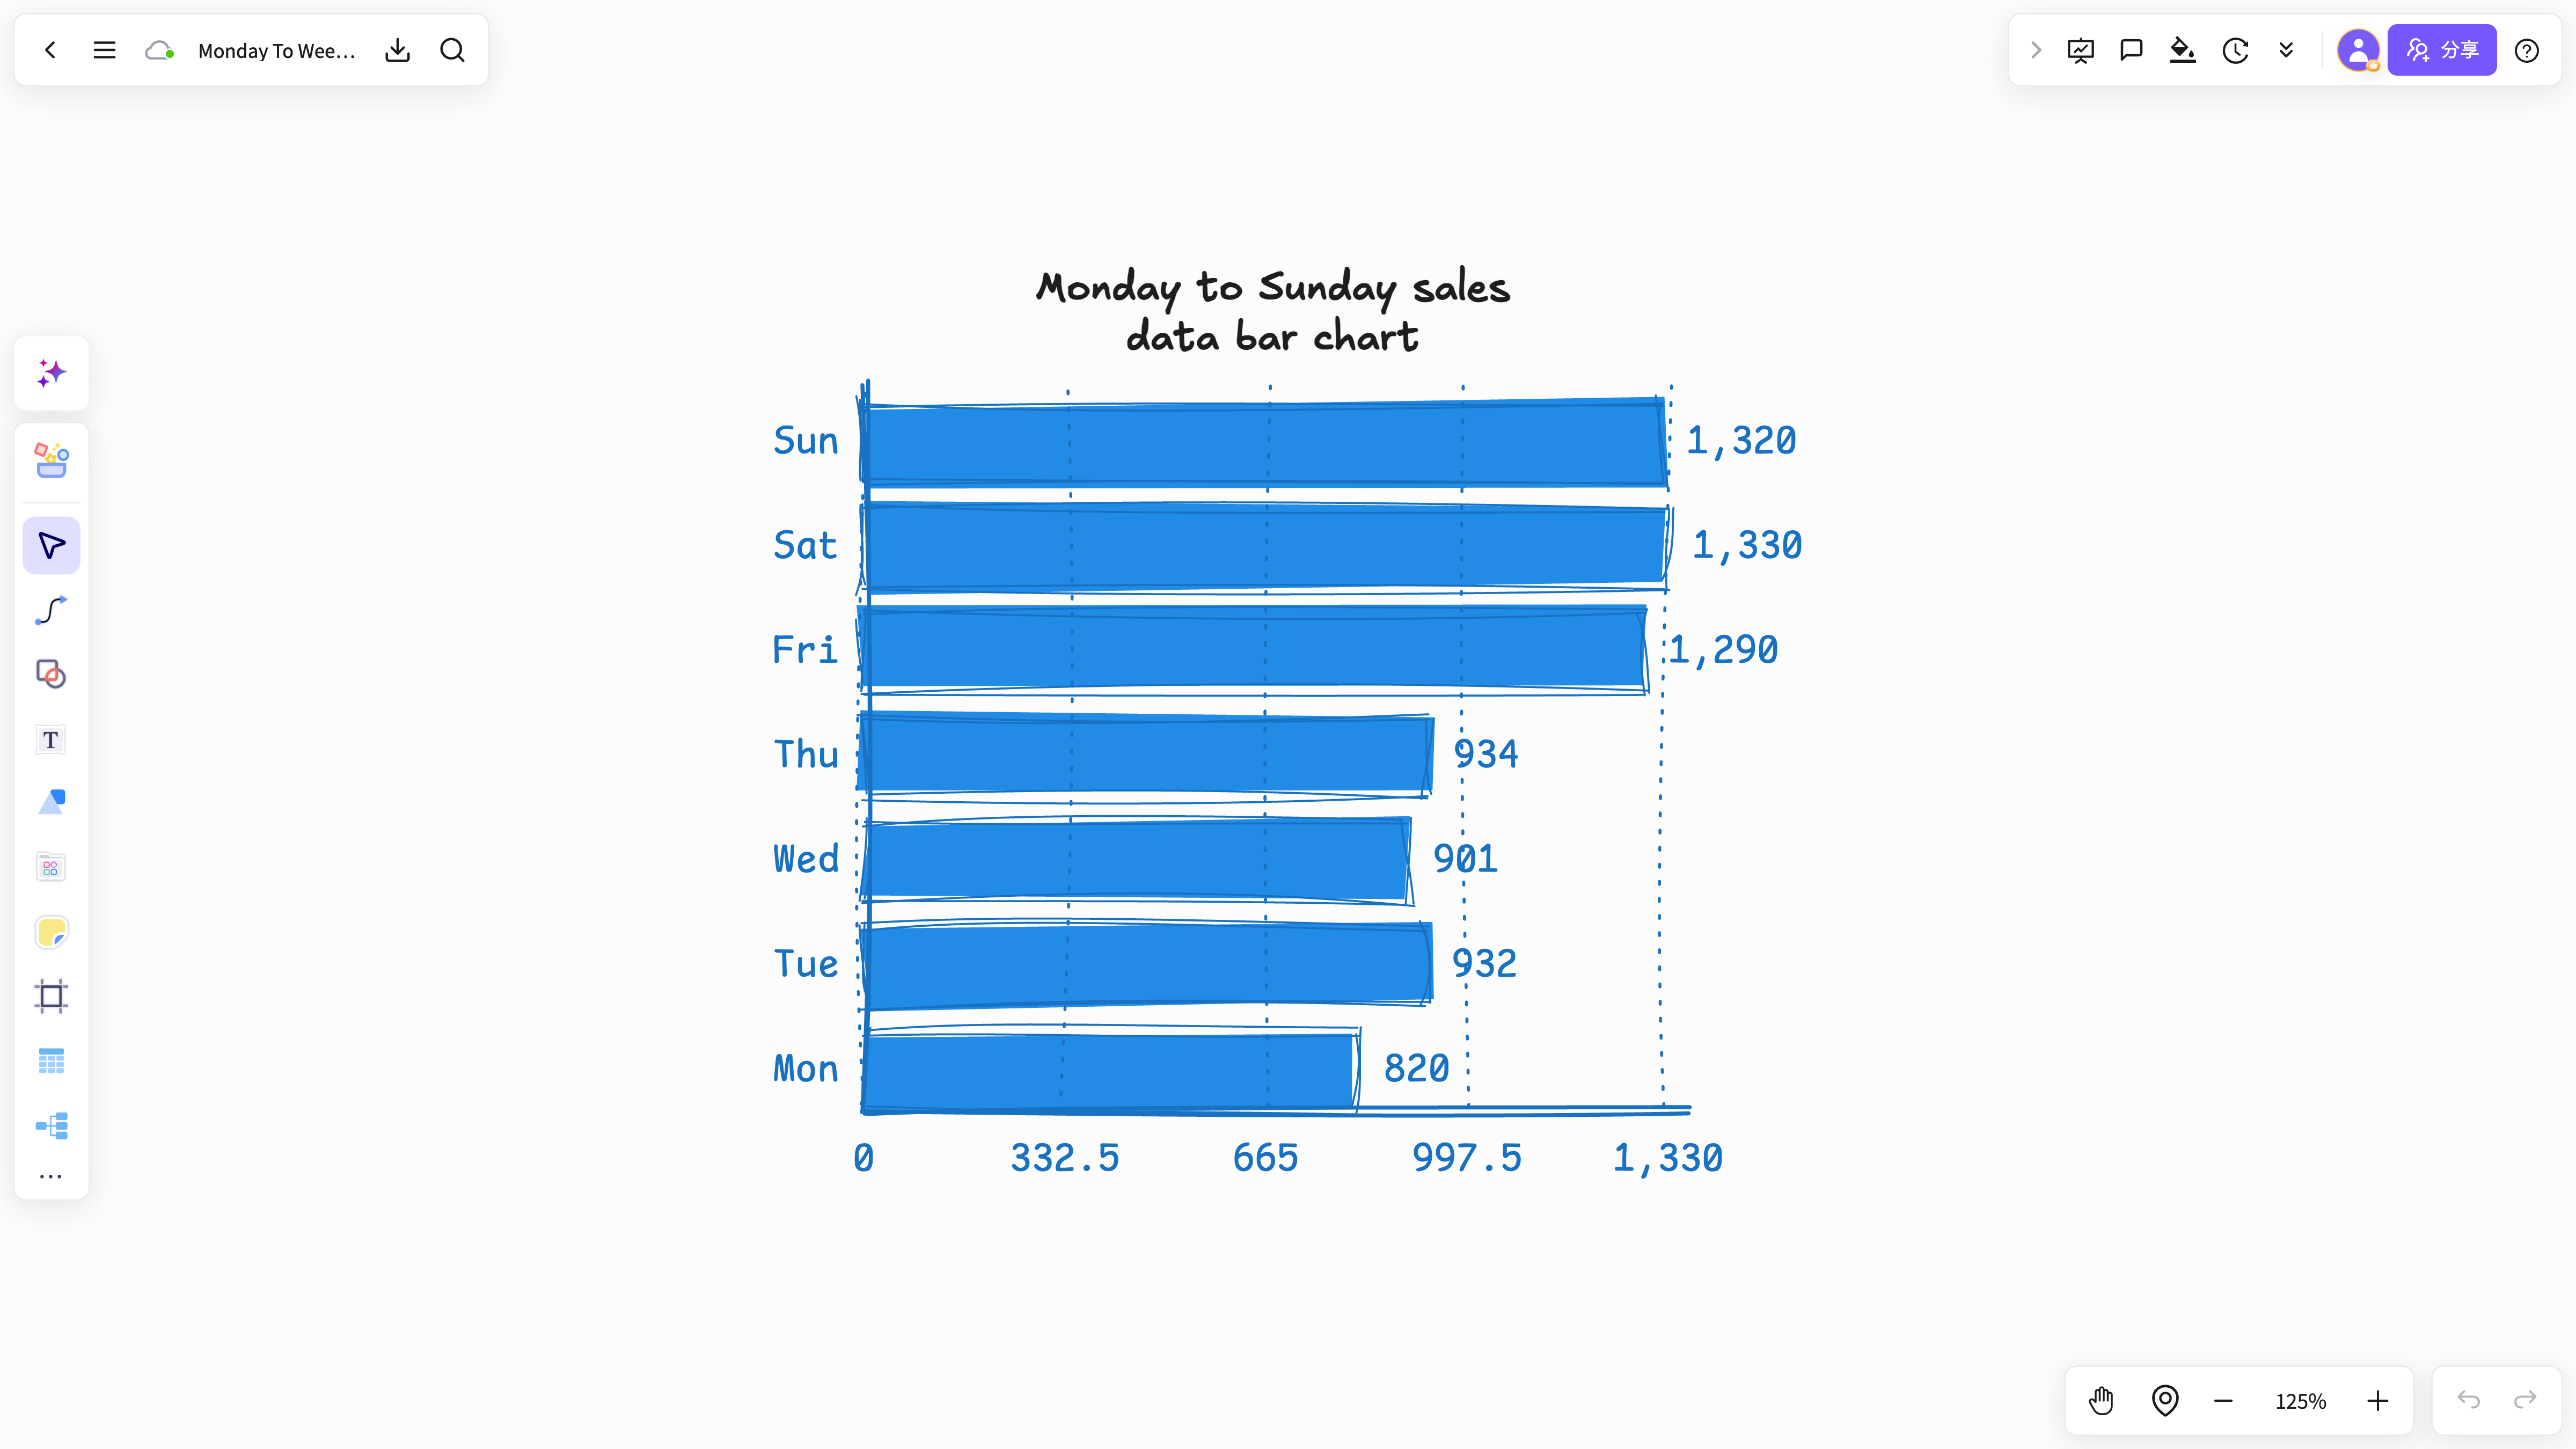
Ideal for sales comparisons, department summaries, project progress, and metric comparisons.
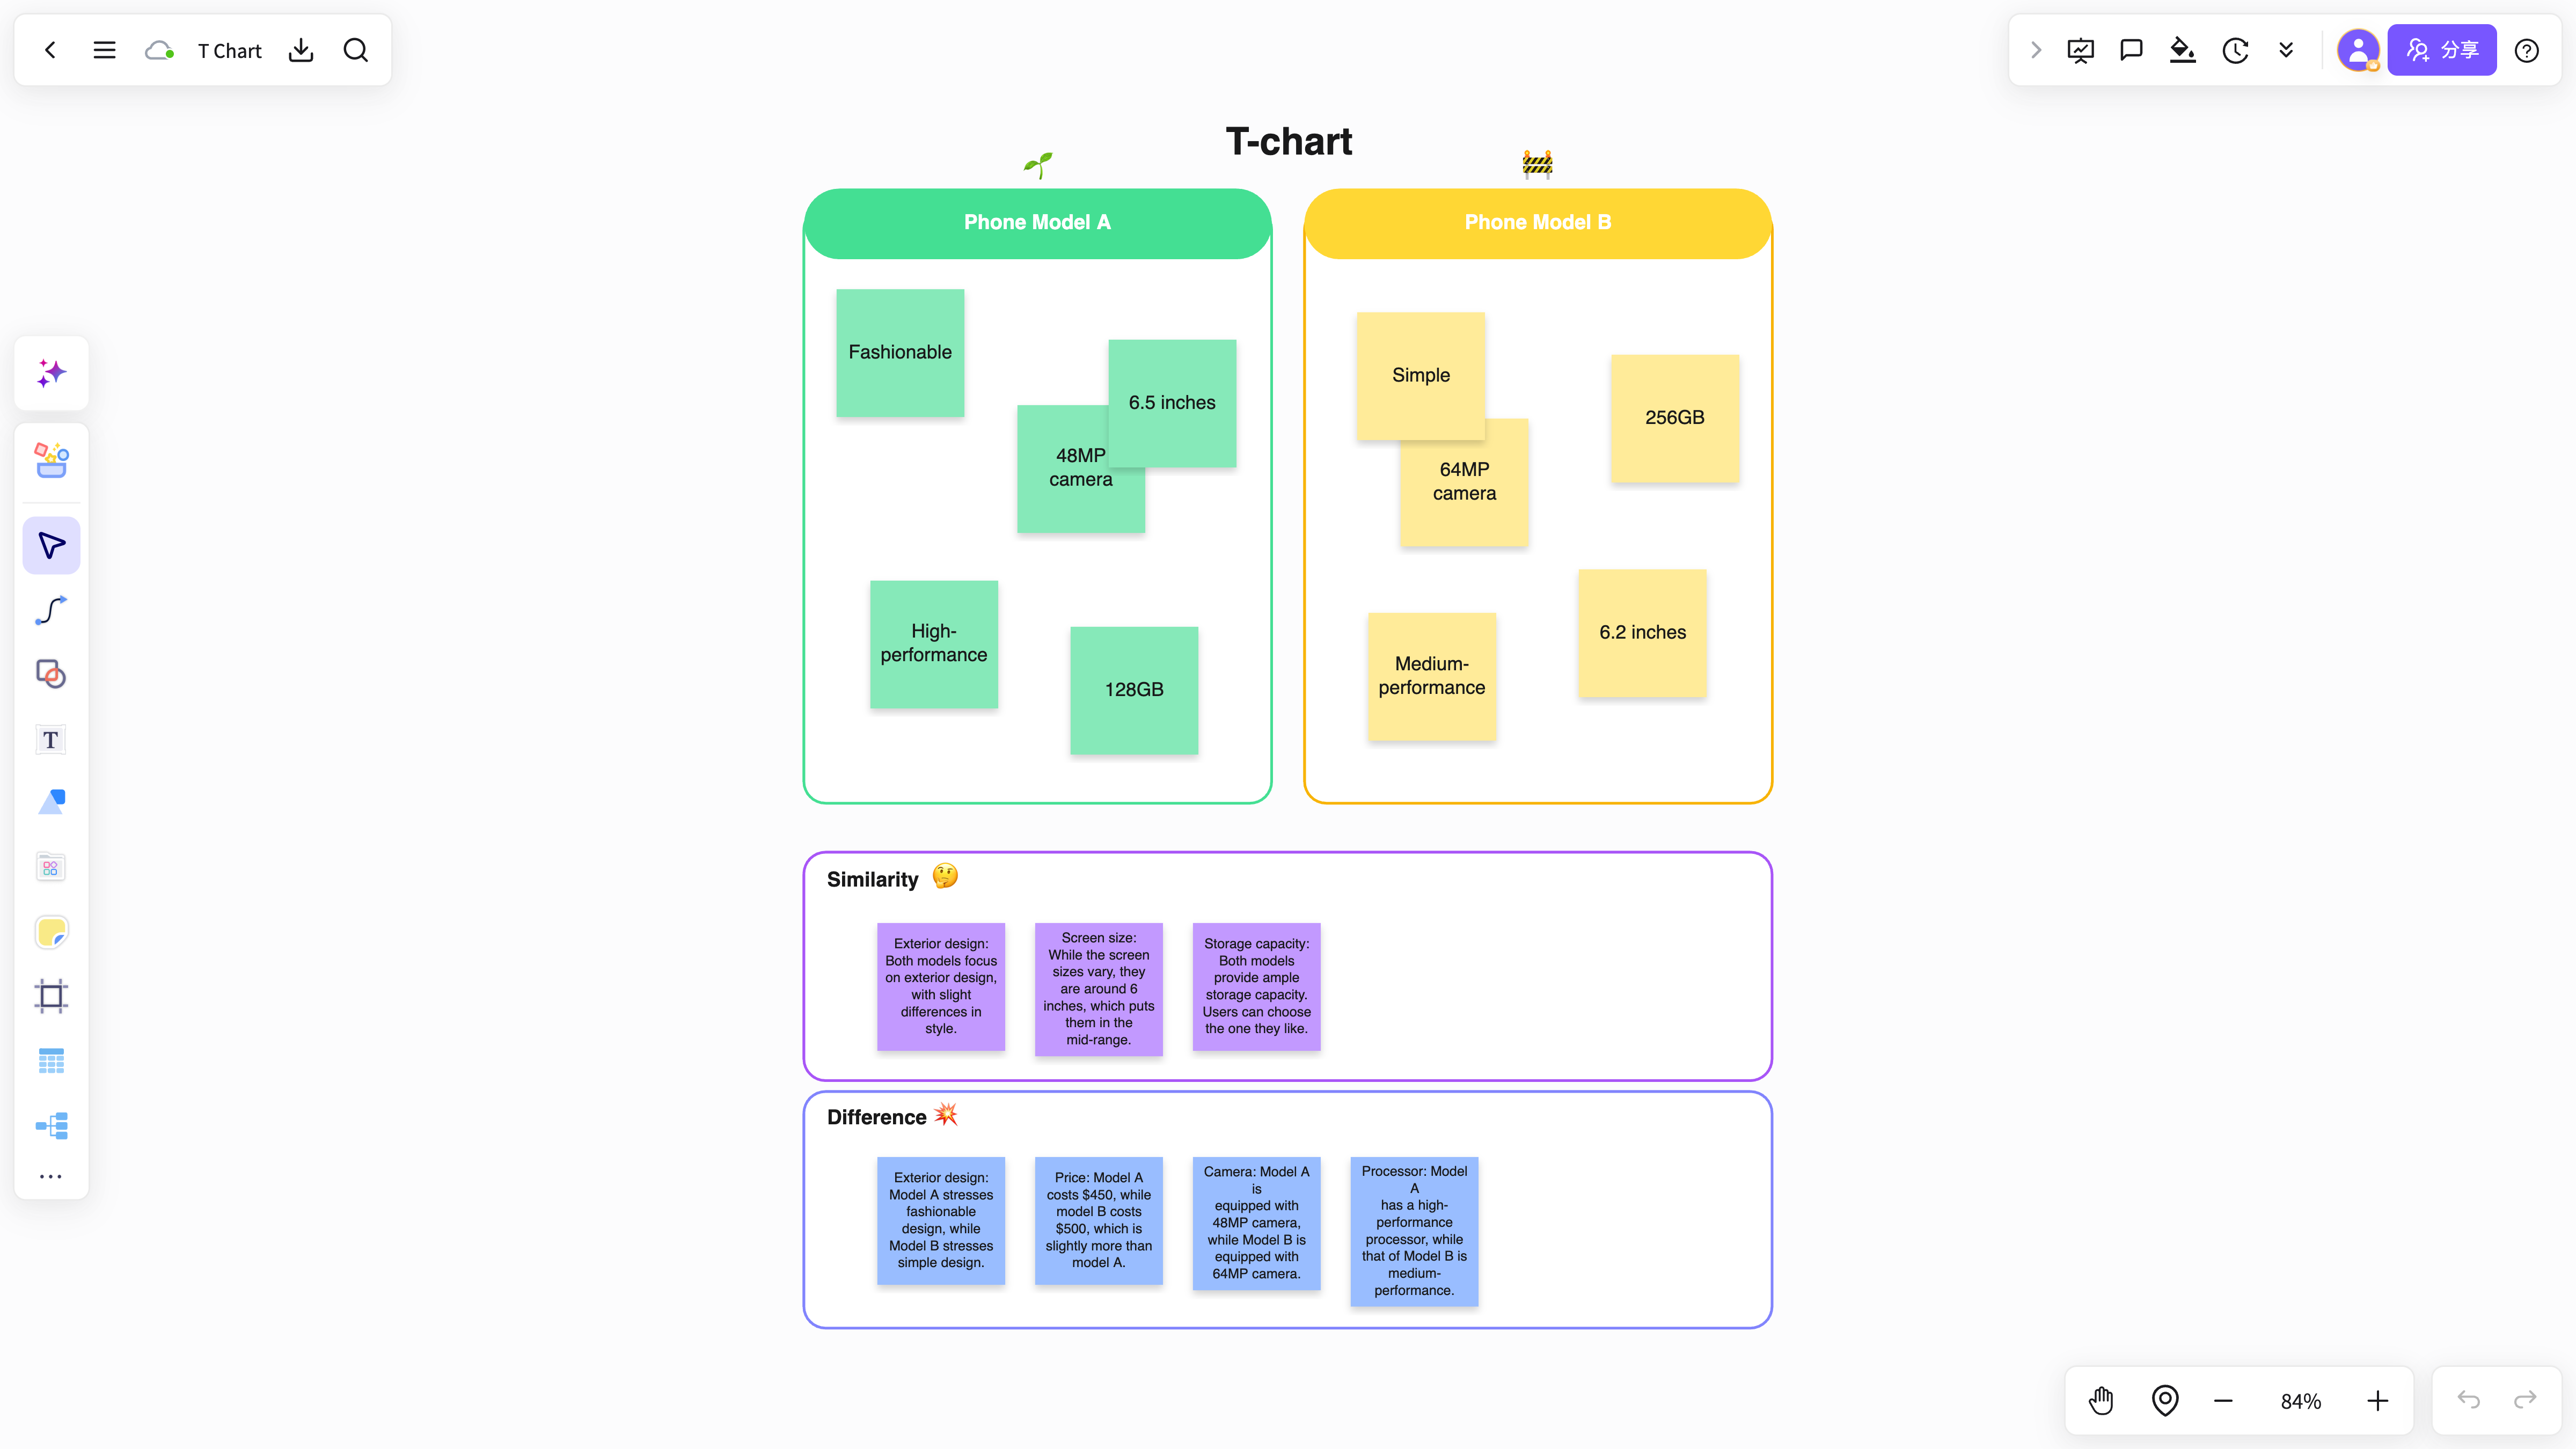
Ideal for trends, growth paths, cycle fluctuations, and stage-by-stage performance.
Skip manual charting. Add business context, metric definitions, or table content to generate an editable chart draft.
Start free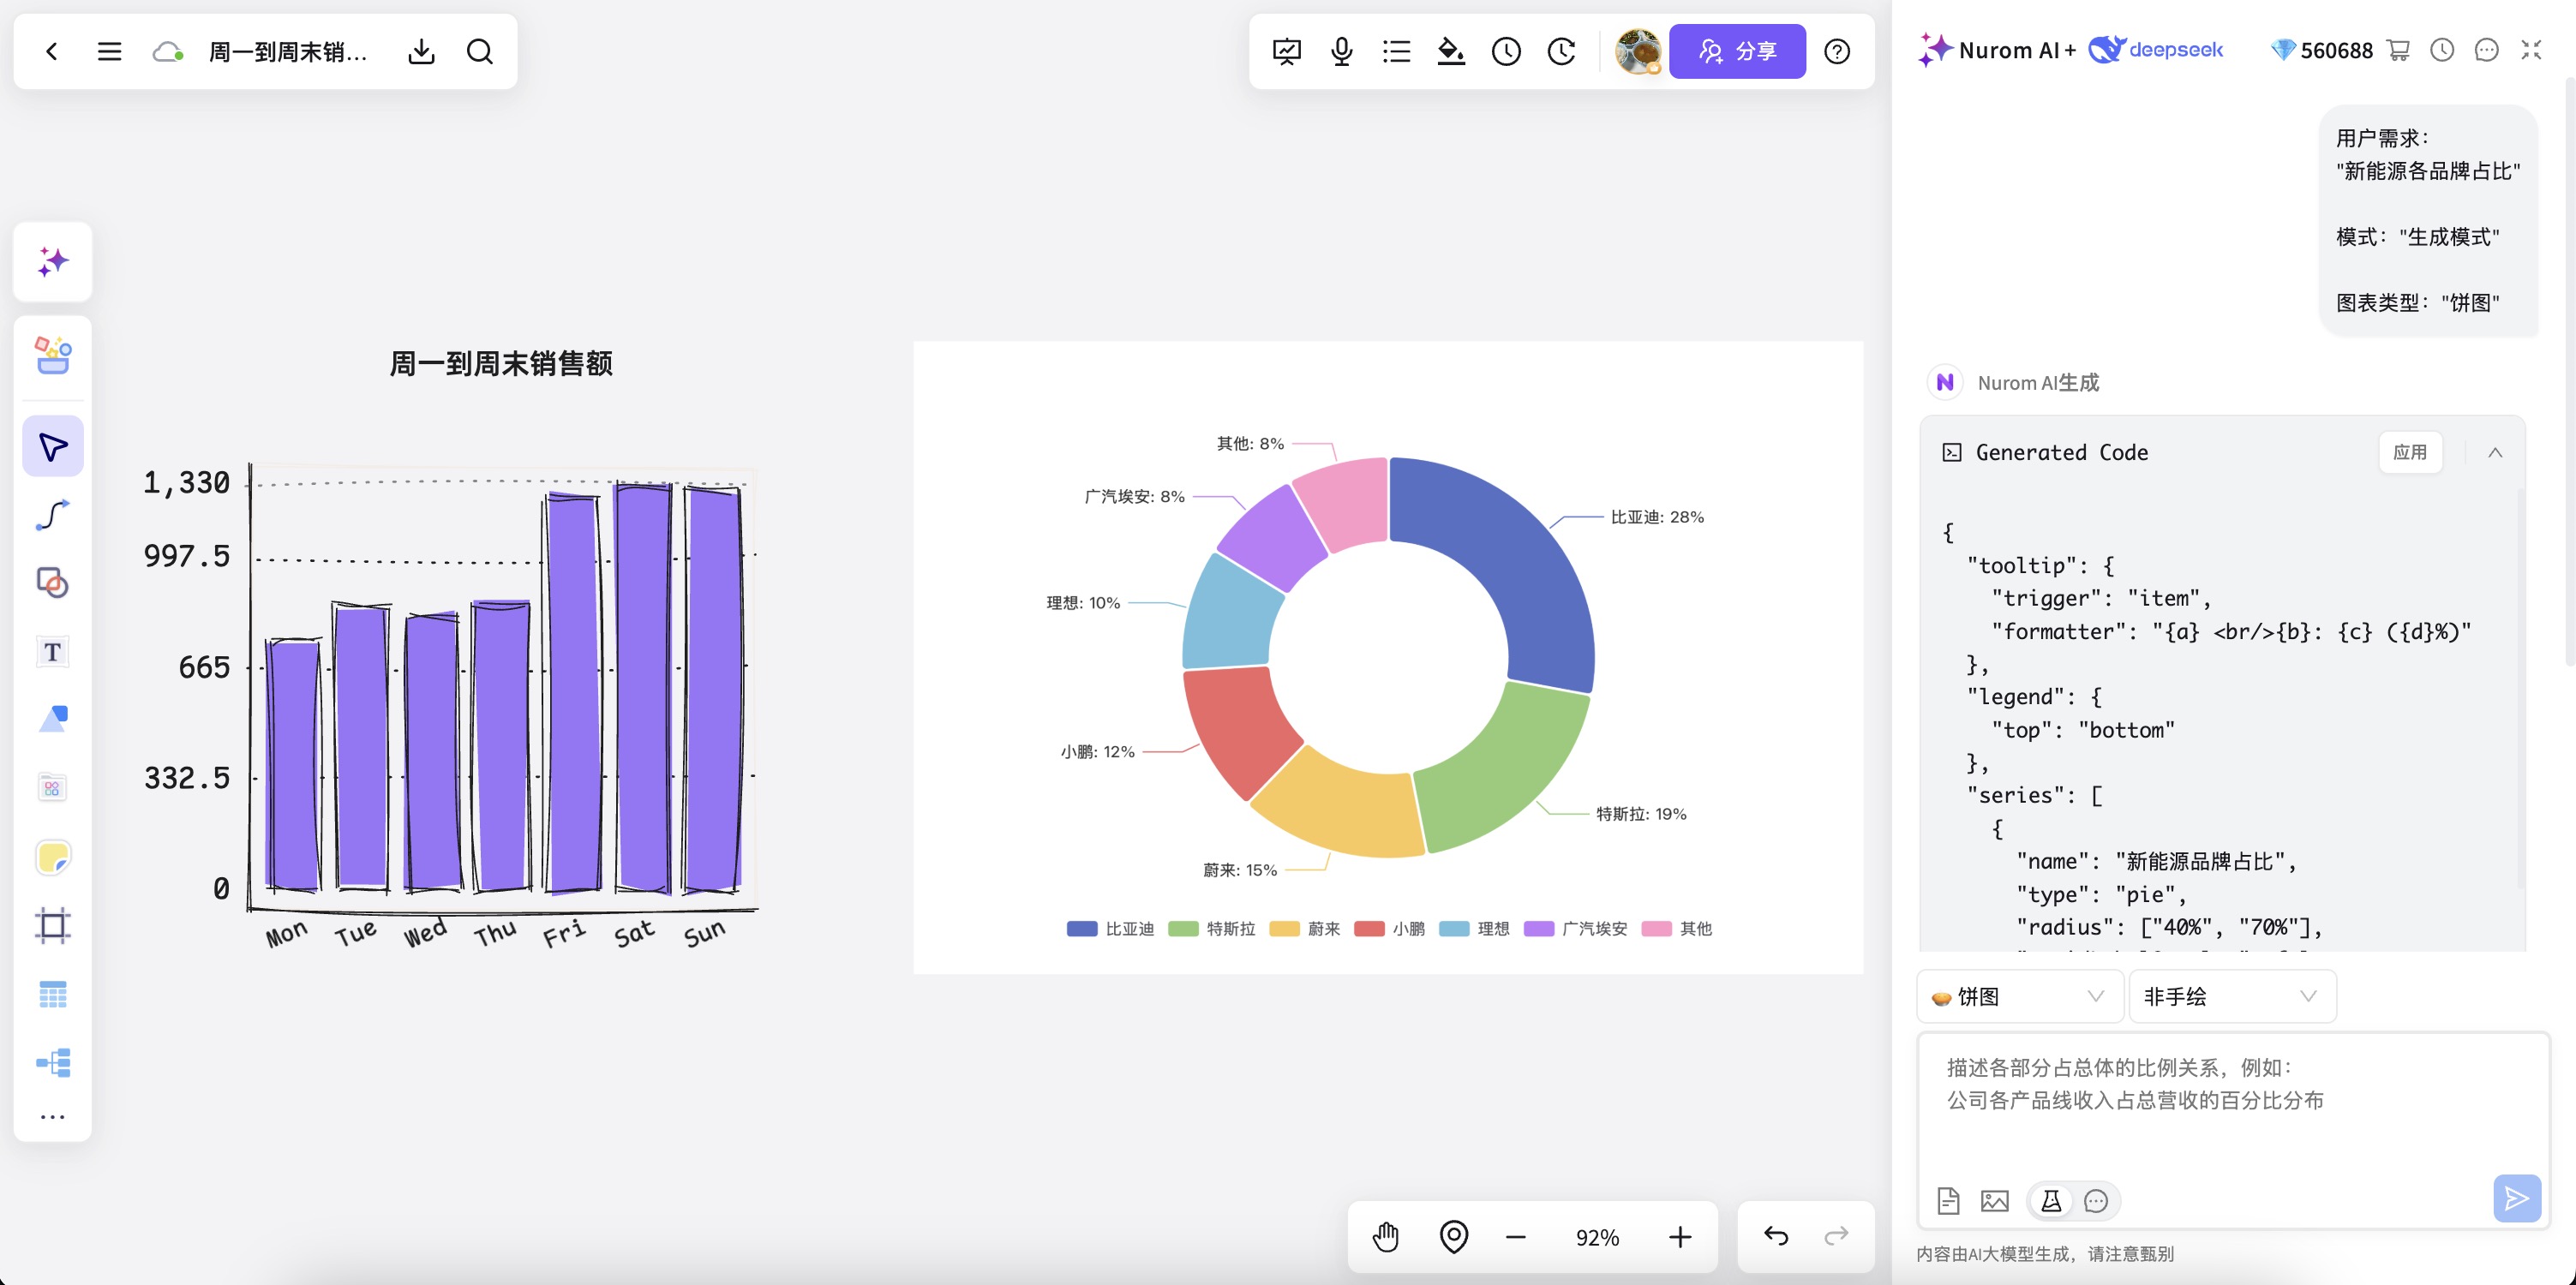
Adjust pie, bar, line, radar, and funnel charts as you explore the best way to present your data.
Start free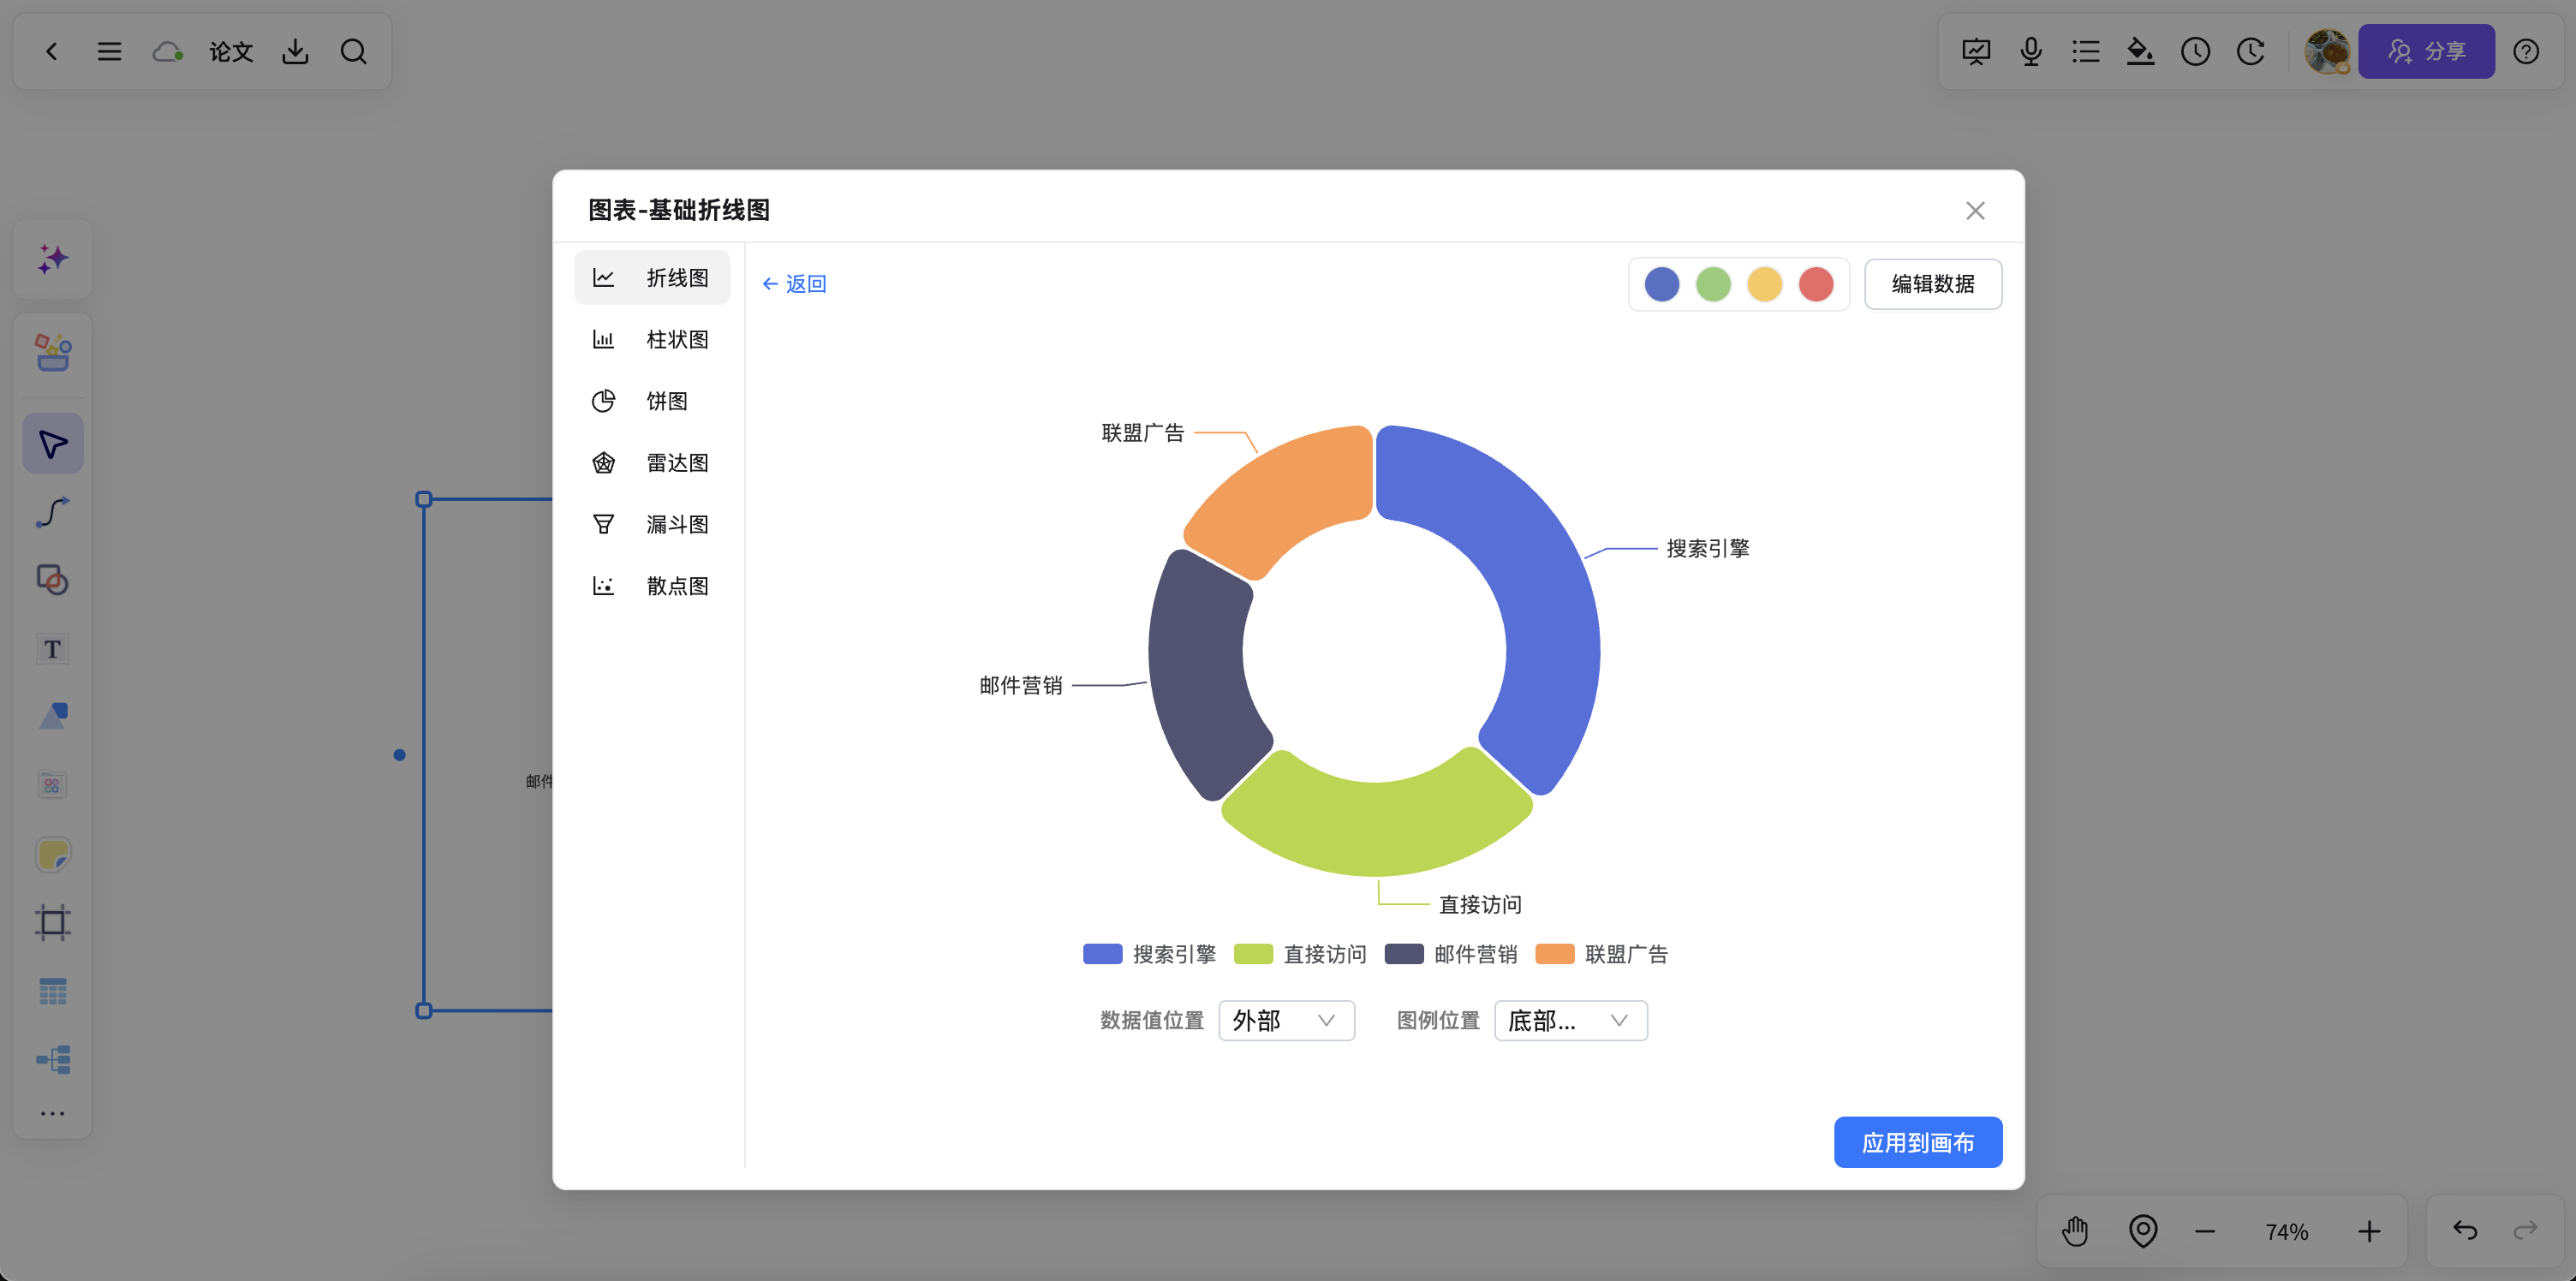
Keep notes, conclusions, annotations, and screenshots beside charts so data becomes part of a complete analysis workflow.
Start free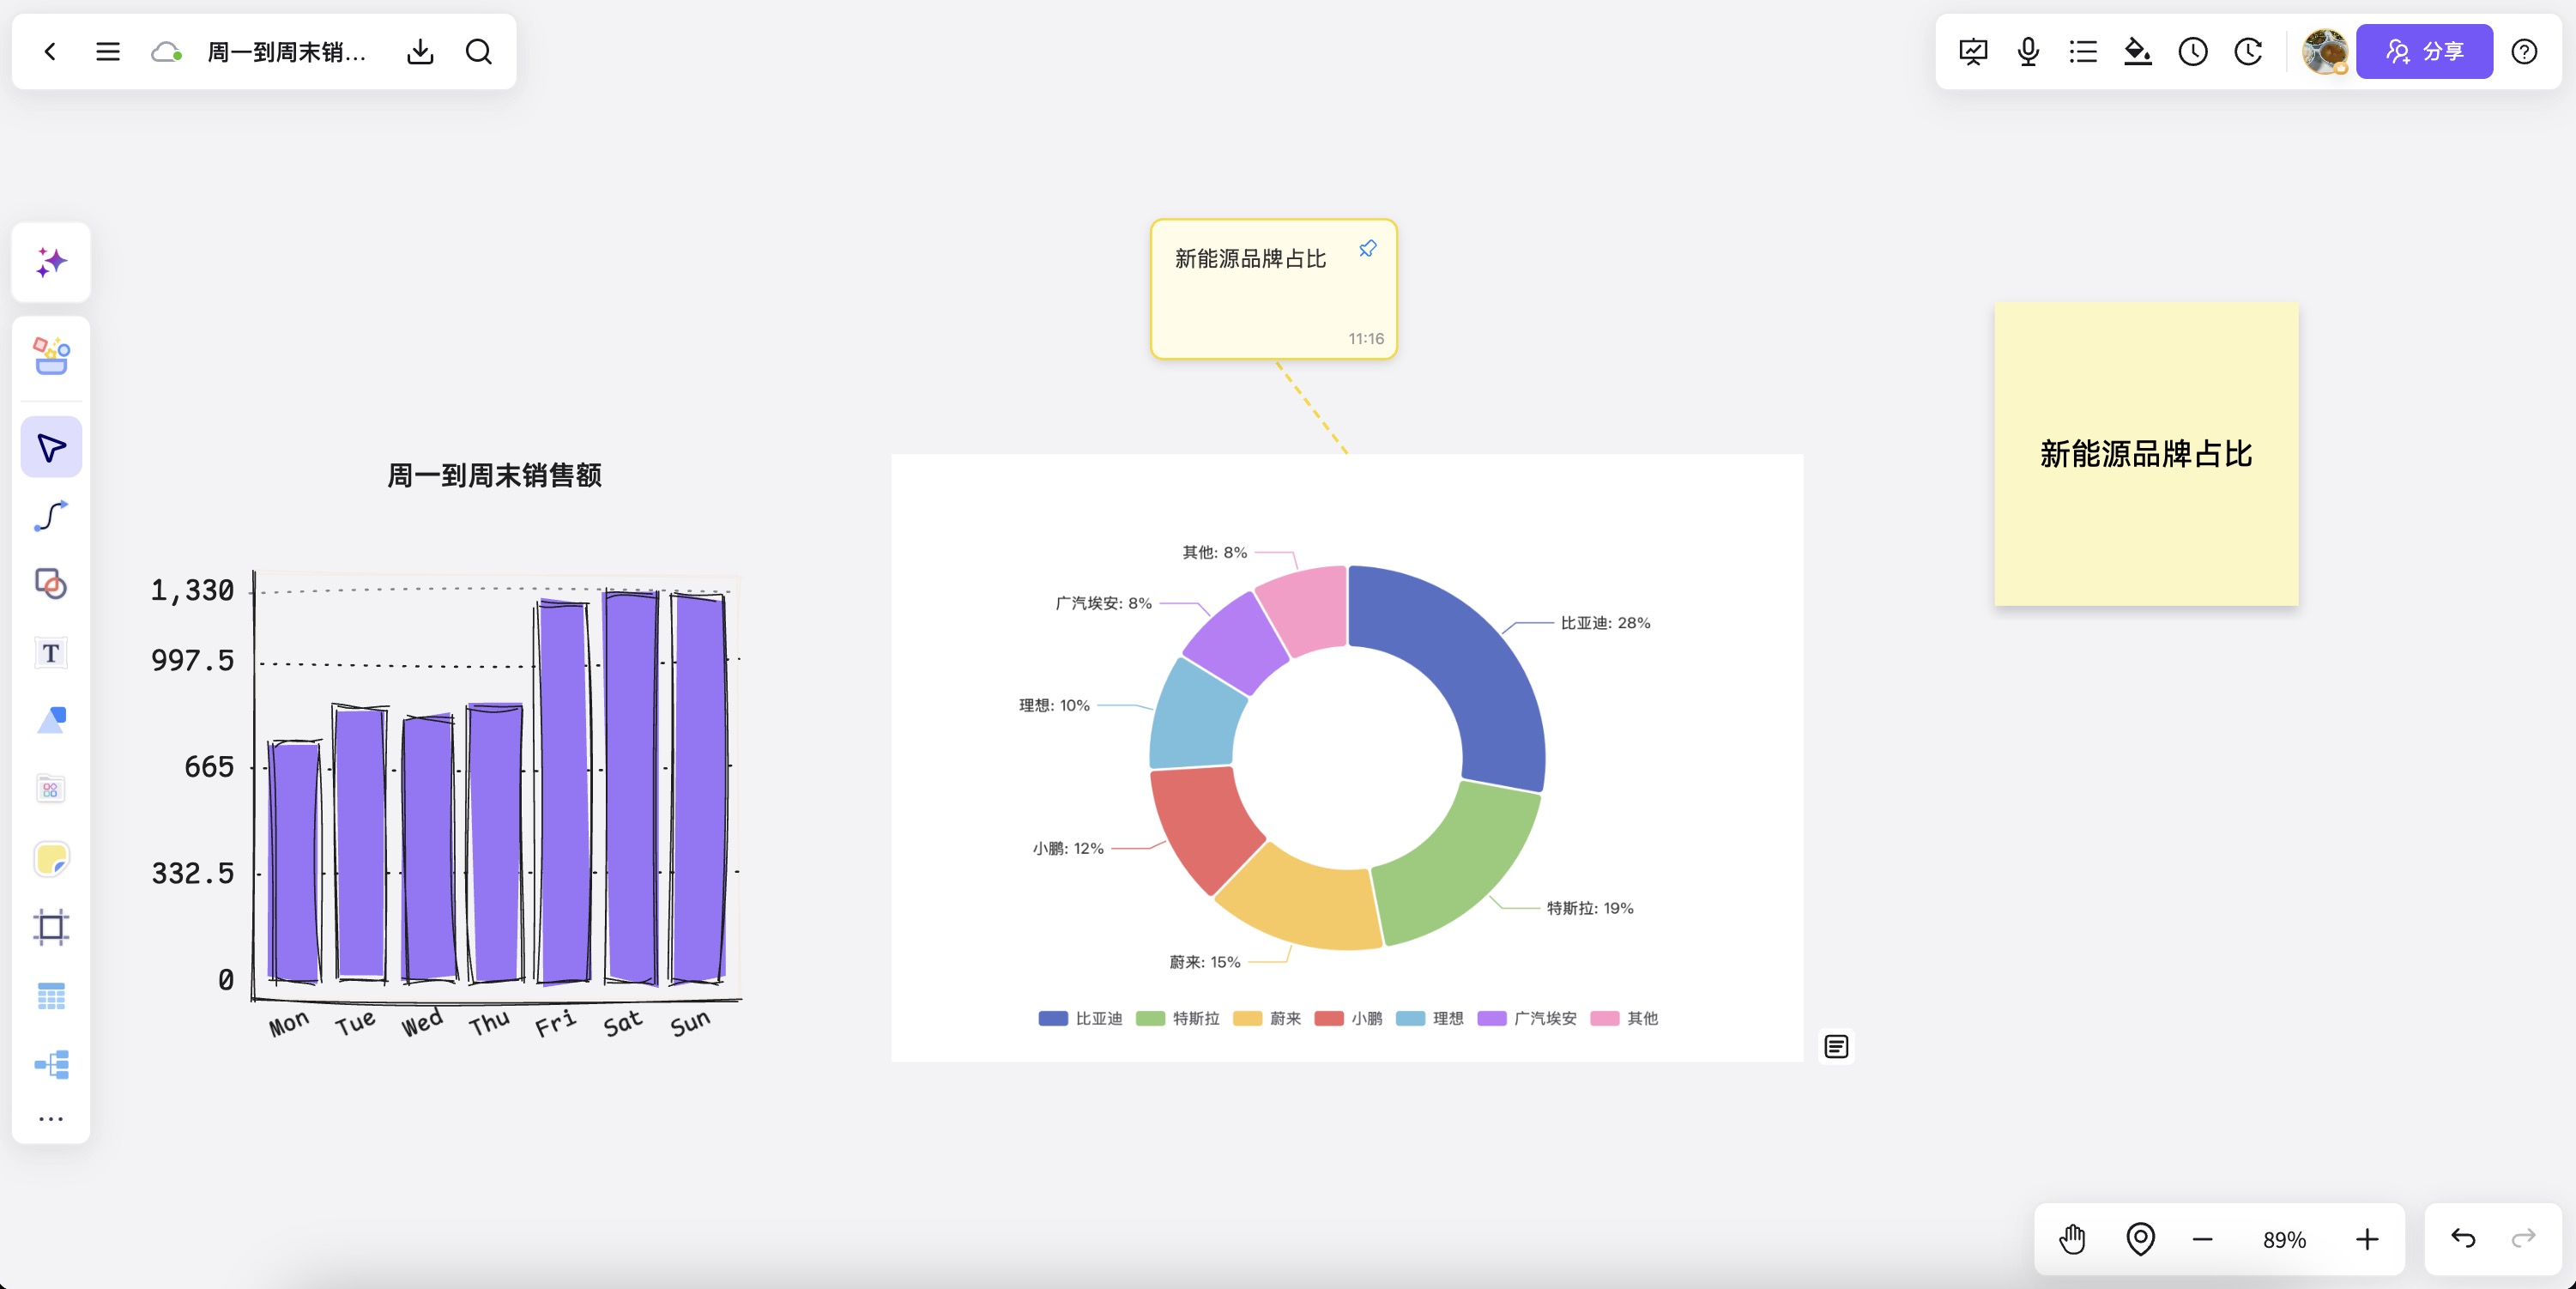
From AI-generated charts and team discussions to captured insights and page presentations, make data communication complete.
Generate and switch between pie, bar, line, radar, and funnel charts quickly.
Add a topic, explanation, or data context to automatically create a fitting chart structure.
Write conclusions, add annotations, include screenshots, and organize key points beside each chart.
Review charts, add conclusions, share feedback, and align the final presentation with your team.
Move from analysis draft to page presentation in one workspace without moving content between tools.
Reuse finished chart structures for reports, weekly updates, and business retrospectives.
Generate charts, add conclusions, collaborate, and present in NuromBoard to move data work forward smoothly.
Start free onlineAnswers about workflows, collaboration, and structure that lasts after the meeting.
AI chart generator helps with brainstorming, planning, business analysis, project work, and team collaboration when ideas and materials need to become a clear, editable result.
NuromBoard turns documents and meetings into editable structures on one shared working file — so AI chart generator moves from a draft into something the team keeps refining after the session.
Yes. Teams edit together, leave feedback, share work online, and review versions on the same working file so discussion and decisions stay connected after the meeting.
Yes. Consultants use AI chart generator alongside frameworks like SWOT, PEST, and competitor analysis to structure findings and present recommendations, and teams can invite clients to review the same shared working file.